Benchmarks
→ Go! Category:Hotel info
Benchmarks
Benchmarks are interesting, as they give you interesting numbers to compare your own hotel's numbers to.
In your Team File the tab Dashboard shows two interesting lines with benchmarks on occupancy rates. We look at the long term numbers: of course due to Covid the situation has changed dramatically. Still, the long term numbers are relevant if we look ahead, at the recovery of the industry.
Check the actual numbers on Statista, hotel occupancy rate per region.
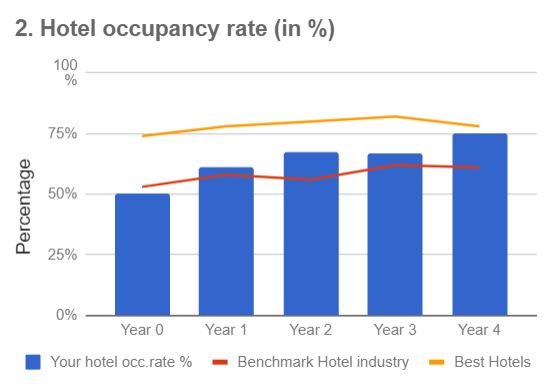
Of course there are big differences depending on the season, political situation, prices and all kind of other things. On an average, hotels of the likes of Emerald Forest will score 50% if we look at the total of a year (before COVID). Information in the dashboard of an individual hotel might look like:
- The first line is the benchmark of the total of the hotel industry. So this is a kind of average
- The second line shows the top-performing city hotels in the world.
- The blue bars are the results of the heavily under-performing hotel in this example.
This gives you some perspective on the occupancy rate you can or should realize each year. As you take over the occupancy rate is 50%.
Other interesting ratios can be found on the tab 'Results' and on in the tab 'Dashboard'.
More numbers
The website what does it cost to build a hotel gives some outlines on the total of investments building a new hotel. Renovation costs this website gives some insights. Looking at KPI's and ratio's in general, check this site.
Of course, any situation is different, any time frame (think of the Covid period), the owners ship, the state (quality) of the premises etc.
→ GO! top of this page

