Difference between revisions of "Fixed costs"
Vinkesteijn (talk | contribs) |
Vinkesteijn (talk | contribs) |
||
| Line 5: | Line 5: | ||
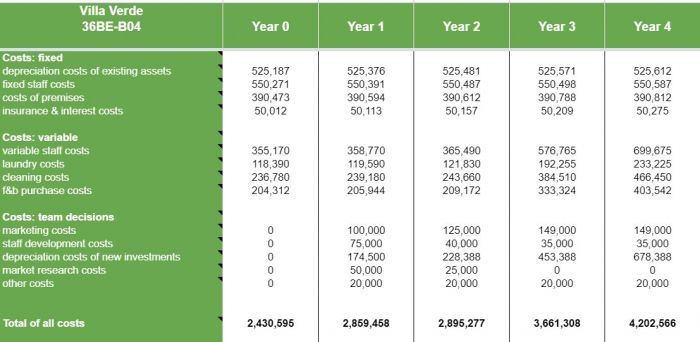
[[Image:Results costs 2021 03.jpg|thumb|700px| center| <center>''Example of all data on costs throughout the years.''</center>]] | [[Image:Results costs 2021 03.jpg|thumb|700px| center| <center>''Example of all data on costs throughout the years.''</center>]] | ||
As you can see in this example above shows the operating review of a demo Management Team after four years: this is how it looks in your Team File. The year 0 is your starting position, (these data are available), the other four years are just an impressions how things might develop:<br> | As you can see in this example above shows the operating review of a demo Management Team after four years: this is how it looks in your Team File. The year 0 is your starting position, (these data are available), the other four years are just an impressions of how things might develop:<br> | ||
More info on costs: | More info on costs: | ||
* the [[fixed costs]] have stayed the same during all four years, the fixed depreciation costs are one of them. | * the [[fixed costs]] have stayed the same during all four years, the fixed depreciation costs are one of them. | ||
Revision as of 08:57, 19 April 2021
→ Go! Category:Hotel info
Structure of the costs groups
In your operating review at the tab results there are three major groups of costs. On mouse-over the firsts cells with the small black triangle, you will get additional information on the numbers.
As you can see in this example above shows the operating review of a demo Management Team after four years: this is how it looks in your Team File. The year 0 is your starting position, (these data are available), the other four years are just an impressions of how things might develop:
More info on costs:
- the fixed costs have stayed the same during all four years, the fixed depreciation costs are one of them.
- the variable costs depend on the occupancy rate like laundry: the more rooms occupied the more laundry.
- the Costs Management Team Decisions, will depend on the Year 1-2-3-4 decisions made by the new Management Team.
Overview of total of the fixed costs
Let's check the fixed costs, as they looked like at the moment you take over: in the picture the grey area. In the table underneath the green numbers.
| Costs | ||||
|---|---|---|---|---|
| Costs: fixed | Depreciation costs of existing assets | € 525,187 | 34.64% | |
| Fixed staff costs | € 550,271 | 36.29% | ||
| Costs of premises | € 390,473 | 25.75% | ||
| Insurance & interest costs | € 50,012 | 03.29% | ||
| Total fixed costs | € 1,515,943 | 100% | 62.36% | |
| Costs: variable | Variable staff costs | € 355,170 | 38.95% | |
| Laundry costs | € 118,390 | 12.94% | ||
| Cleaning costs | € 236,780 | 25.88% | ||
| F&B purchase costs | € 204,312 | 22.33% | ||
| Total variable costs | € 914,652 | 100% | 37.63% | |
| Costs: team decisions | Marketing costs | € 0 | 00.00% | |
| Extra staff development costs | € 0 | 00.00% | ||
| Extra depreciations costs | € 0 | 00.00% | ||
| Market research costs | € 0 | 00.00% | ||
| Other costs | € 0 | 00.00% | ||
| Total team decisions costs | € 0 | 100% | 00.00% | |
| Total all costs | € 2,430,595 | € 2,430,595 | 100% |
Explanations on this
You can't influence these fixed costs. These are costs which will be created no matter what the occupancy rate is. Over the years there can be small fluctuations, but the amounts will stay almost the same. They will be automatically calculated and visible in your operational review. They make up 62.36% of the total costs as you take over.
- Depreciation costs of existing assets: depreciation of all the assets especially the building, fixtures and fittings.
- Fixed staff costs: staff needed to run the hotel and which have to be paid even if there are no guests at all.
- Costs of premises: costs of maintenance, repairs on small adaptions to the building and the parking lots.
- Insurance & interest costs: costs for insurance for staff, building a liability and costs for mortgage and other loans.
More numbers
Check basic set-up of costs groups in hotels to have some reference on the numbers.
Of course, any situation is different, any time frame (think of the Covid period), the owners ship, the state (quality) of the premises etc. The file, though, this might give some ideas from a calculative perspective.
→ GO! Top of this page

